Disclaimer:This technical analysis by Leah Donovan is for educational purposes only and should not be considered as financial advice.Trading involves risk,and you should always do your own research before making investment decisions.Past performance does not guarantee future results.The analysis reflects the author's personal methodology and risk tolerance(high). According to Finder’s panel, industry specialists forecast an average price target of $331 by year-end, with bullish outliers eyeing $1,000 by 2030 (Benzinga). Meanwhile, InvestingHaven’s technical patterns support a range between $255-$480 (source). But what matters most isn’t just price - it’s utility. Every major jump in valuation has been matched by new use cases emerging on-chain.
Solana (SOL) Price Prediction: 2026–2031
Comprehensive expert projections based on current 2025 market data, adoption trends, and regulatory context.
| % Change YoY (Avg) | Market Scenario Insights |
|---|
| 2026 | $210 | $340 | $520 | +2.7% | Price consolidates after 2025 surge; ETF approvals and institutional inflows sustain growth. Bearish scenario reflects regulatory delays. |
| 2027 | $250 | $410 | $690 | +20.6% | Increased adoption in DeFi/TradFi, successful ETF launches. Bearish case: macro headwinds or tech competition slow growth. |
| 2028 | $280 | $470 | $860 | +14.6% | Mainstream TradFi integration, more Layer-2s and rollups. Bearish: scaling bottlenecks or regulatory setbacks. |
| 2029 | $320 | $550 | $1,050 | +17.0% | Solana cements position as top-3 chain; major institutional products live. Bearish: global recession or security incidents. |
| 2030 | $370 | $640 | $1,250 | +16.4% | Next-gen dApps, global payments, and cross-chain adoption. Bearish: loss of developer mindshare or harsh global regulation. |
| 2031 | $410 | $720 | $1,460 | +12.5% | Widespread enterprise and retail use. Bearish: tech disruption from competitors or market cycle downturn. |
Price Prediction Summary
Solana is positioned for steady growth over the next six years, with a consensus average price rising from $340 in 2026 to $720 by 2031. Bullish scenarios see SOL potentially reaching $1,460 if institutional adoption, ETF approvals, and network upgrades proceed smoothly. However, downside risks remain from regulatory, technological, or macroeconomic headwinds. Year-over-year average growth is projected between 12% and 21%, reflecting both optimism and market volatility.
Key Factors Affecting Solana Price
- Regulatory approval and launch of Solana ETFs and futures products
- Continued institutional adoption and inflows
- Network scalability, upgrades, and ecosystem development (DeFi, NFTs, TradFi integration)
- Competition from other Layer-1/Layer-2 chains (Ethereum, emerging platforms)
- Macroeconomic conditions (interest rates, recession risk)
- Potential for new use cases (payments, remittances, enterprise apps)
- Security and technical reliability of the Solana network
Disclaimer: Cryptocurrency price predictions are speculative and based on current market analysis.
Actual prices may vary significantly due to market volatility, regulatory changes, and other factors.
Always do your own research before making investment decisions.
Expert Predictions: How High Can SOL Go?
The consensus among analysts is clear: Solana is positioned as a core pillar in the next wave of financial innovation. With current prices steady at $233.08, experts see significant upside if ETF approvals materialize or if tokenized asset adoption accelerates. CryptoRank recently reported that institutions scooped up over 6.8 million SOL on-chain this quarter alone - not just betting on price appreciation but on long-term network value.
Key Drivers Fueling Solana’s Wall Street Integration
CME Group’s Planned Solana Futures Launch: The CME Group—the world’s largest derivatives exchange—announced plans to introduce Solana futures on March 17, 2025 (pending regulatory approval). This move provides Wall Street with regulated tools for price risk management and signals growing institutional acceptance. ETF Filings by Major Financial Firms: Leading asset managers like 21Shares and VanEck have filed with the SEC to launch Solana-linked ETFs. Approval of these ETFs would make Solana exposure more accessible to institutional and retail investors, mirroring the impact seen with Bitcoin ETFs. Surging Institutional Trading Volumes: Solana’s trading volume has seen a 57% increase in recent days (The Economic Times), reflecting heightened institutional interest and liquidity—a critical factor for Wall Street adoption. Strong and Stable Price Performance: As of October 3, 2025, Solana (SOL) is trading at $233.08, up 0.54% in the last 24 hours. This price stability and upward momentum enhance its credibility as a reliable asset for institutional portfolios. Bullish Analyst Predictions for 2025: Panels of crypto industry experts forecast Solana’s average price at $331 by end of 2025 (Finder), with some estimates reaching $480 (InvestingHaven). These bullish outlooks are driving increased Wall Street attention and positioning Solana as a serious contender alongside Bitcoin and Ethereum. Technological Advancements and Ecosystem Growth: Solana’s high throughput, low transaction costs, and expanding DeFi and NFT ecosystems continue to attract institutional developers and investors, reinforcing its integration into traditional finance.
Solana’s edge lies in its ability to blend the speed and cost-efficiency of Web3 with the regulatory ambitions of traditional finance. As CME Group’s futures launch looms and ETF filings await SEC decisions, liquidity is flowing into Solana at a pace that outstrips most competitors. The $233.08 price point isn’t just a number, it’s a signal of institutional validation and growing on-chain utility.
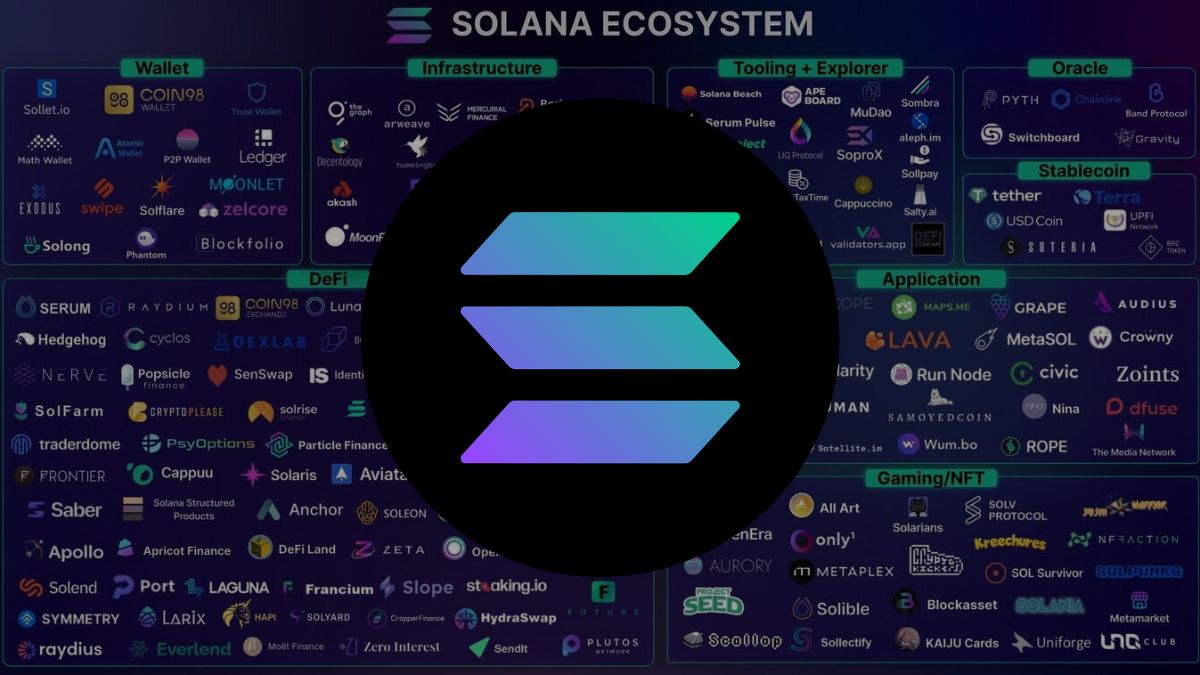
Zooming out, the Solana ecosystem is rapidly onboarding not only DeFi projects but also traditional financial products, RWAs, tokenized stocks, and even synthetic bonds. This convergence is what sets Solana apart from legacy chains. Developers are leveraging composability to create permissionless derivatives, real-time settlement for tokenized U. S. Treasuries, and cross-chain bridges that link TradFi with DeFi rails.
Solana Tokenized Assets: The RWA Revolution Gains Steam
Tokenization of real-world assets (RWA) is no longer a buzzword, it's happening live on Solana. From pilot programs with U. S. Treasury bills to synthetic equity trading desks, institutions are experimenting with on-chain settlement for speed, transparency, and reduced counterparty risk. The result? Stickier liquidity and increased developer activity, two metrics that correlate tightly with long-term price appreciation.
“We’re seeing the first true migration of Wall Street infrastructure onto public blockchains, and Solana is leading the charge. ”
This isn’t just about speculation anymore; it’s about utility-driven growth. The expansion into tokenized stocks and bonds is driving new inflows from both retail traders seeking yield opportunities and institutional players hedging risk or arbitraging inefficiencies.
Top Drivers of Solana’s Wall Street Integration
CME Group’s Launch of Solana Futures: The CME Group plans to introduce Solana futures on March 17, 2025, pending regulatory approval. This move positions Solana alongside Bitcoin and Ethereum in the regulated derivatives market, providing institutional investors with new tools for risk management and exposure. Pending Solana ETFs from 21Shares and VanEck: Leading financial firms 21Shares and VanEck have filed for Solana-based ETFs, with SEC decisions expected soon. Approval would enable Wall Street to access Solana via regulated exchange-traded products, accelerating mainstream adoption. Surging Institutional Trading Volumes: Solana’s trading volume has soared, with a recent 57% spike and its price currently at $233.08 (as of October 3, 2025). This robust activity signals strong institutional interest and liquidity, key factors for Wall Street integration. Bullish Analyst Forecasts and Price Predictions: Industry experts from Finder and InvestingHaven forecast Solana prices between $220 and $480 by late 2025. These optimistic projections are fueling further Wall Street interest and capital inflows. Technological Advancements and Ecosystem Growth: Solana’s high-speed, low-cost blockchain continues to attract developers and DeFi projects. Its expanding ecosystem strengthens its appeal as a foundation for financial products and services favored by institutional investors.
SOL Price Milestone: Holding Strong at $233.08 Amid Institutional Accumulation
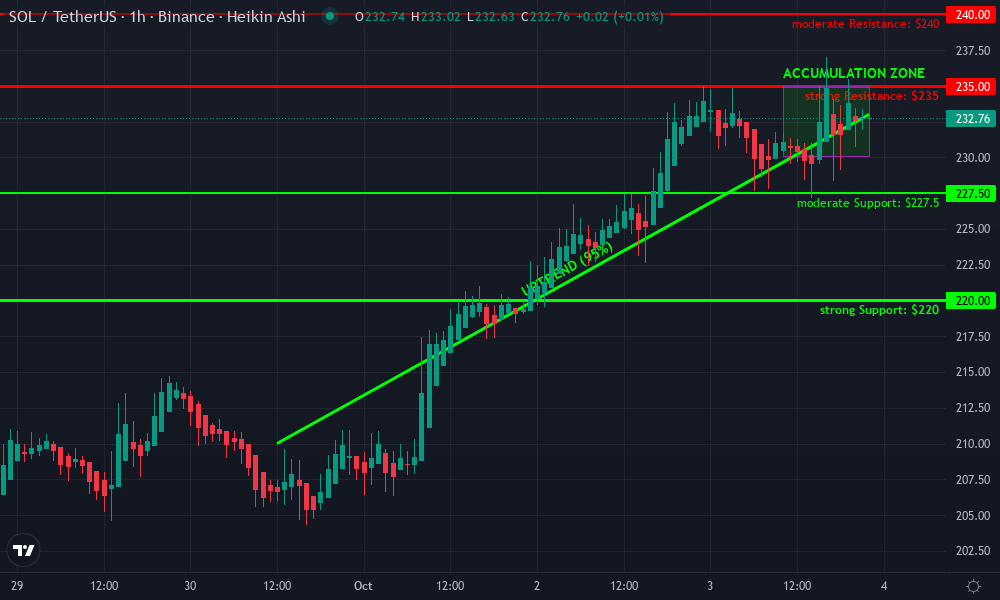
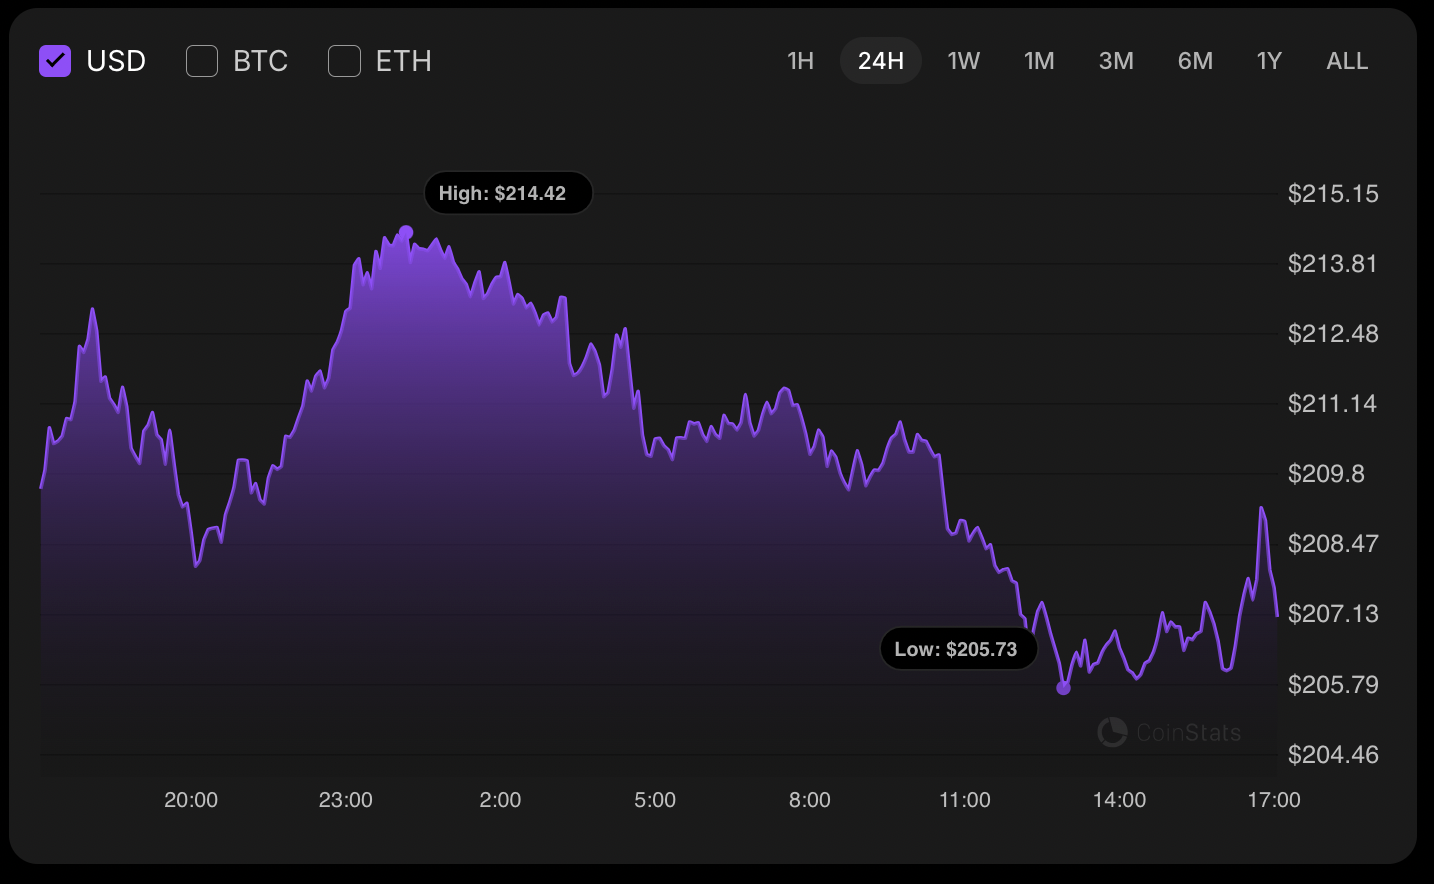
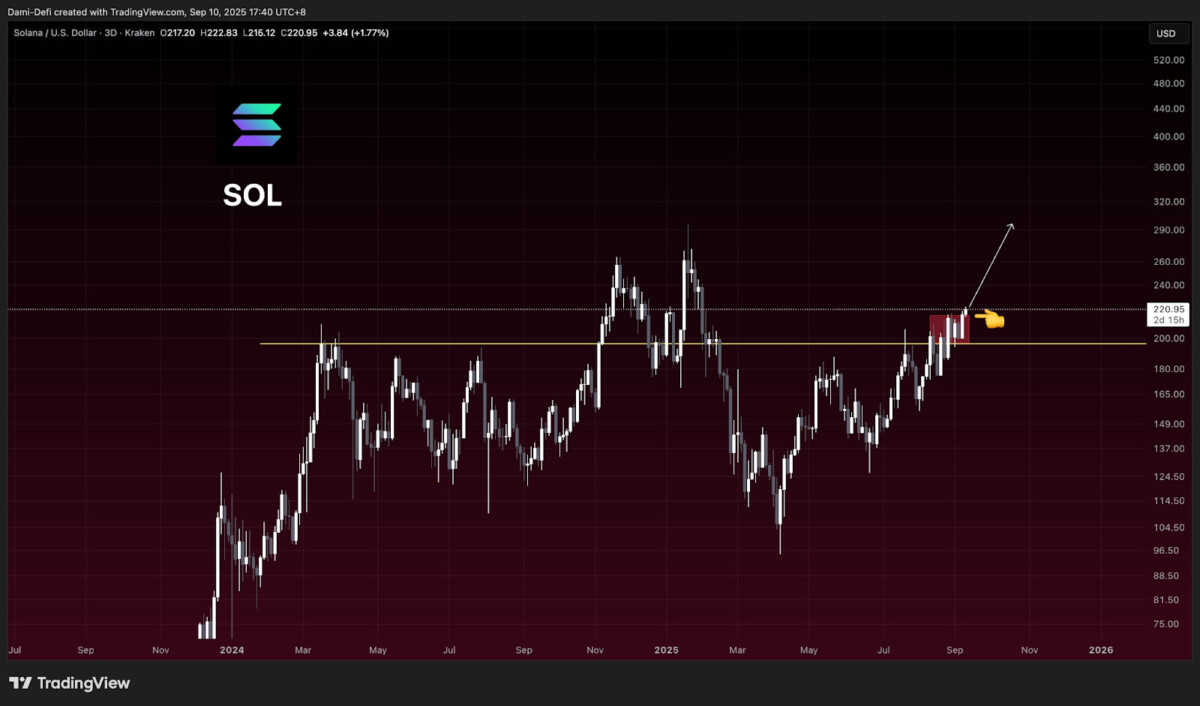
While some analysts project SOL could reach as high as $331 by year-end (Finder) or even $1,000 by 2030 (Benzinga), the current price action tells its own story. After rebounding from lows near $190 in recent months, SOL has stabilized above $230, attracting both speculative capital and long-term strategic buys by institutions.
The technical landscape remains bullish, with support at $220 and resistance forming near $250, but what stands out most is volume: up 57% year-over-year as per The Economic Times. This surge signals not only heightened trading activity but also deeper liquidity pools, a prerequisite for large-scale institutional strategies.
2025 Outlook: Solana’s Wall Street Moment?
If current trends persist, regulatory greenlights for futures/ETFs, continued RWA innovation, sticky developer growth, Solana could cement its role as the “New Wall Street” backbone by 2025-2026. The next six months will be pivotal as ETF decisions unfold and more RWAs migrate on-chain.
For traders, builders, and institutions alike, Solana isn’t just another blockchain, it’s rapidly becoming the preferred platform for tokenized finance at scale. With $233.08 now established as a key support level amid surging volumes and mainstream adoption narratives, all eyes remain fixed on how high this ecosystem can climb, and how fast traditional markets will follow its lead into decentralized rails.
Related Articles

Solana PvP Games Thriving on Ultra-Low Fees for In-Game Trades 2026
Solana's ultra-low transaction fees, often under $0.001, have unlocked unprecedented potential for PvP games in 2026. At a current price of $93.36 with a 24-hour gain of and $4.83, SOL underpins real-time in-game trades of NFTs and tokens...
Mar 16, 2026

Top Solana DEX Leaderboard 2026: Humidifi Beats Pump.fun and Orca in 24H Volume
In the volatile world of Solana DeFi, Humidifi has just rewritten the rules. As of February 11,2026, this powerhouse DEX has surged ahead of Pump. fun and Orca, claiming the number one spot on the Solana DEX leaderboard 2026 with unmatched...
Feb 11, 2026

Play Solana PSG1: Solana's First Dedicated Web3 Gaming Console Explained
Picture this: you're gripping a sleek handheld device that doesn't just crush Solana games 2026 but also safeguards your NFTs and tokens with military-grade security. Enter the Play Solana PSG1, Solana's first dedicated Web3 gaming...
Feb 8, 2026

Solana Gaming Supercycle 2026: Arise Cross The Ages, Jail.fun, GORECATS, Cashcitydotfun Launches Explained
Solana's gaming sector stands at the cusp of a transformative 2026 supercycle , propelled by high-profile launches including Arise Cross The Ages, Jail. fun, GORECATS, and Cashcitydotfun. As Binance-Peg SOL holds steady at $126.04 with a...
Jan 25, 2026
B
Written by
Blu
Author at Solana Radar

No comments yet. Be the first to share your thoughts!