Solana is no longer just a high-throughput blockchain – it’s rapidly becoming the financial backbone of the digital asset era. In 2025, as Wall Street eyes tokenized assets and decentralized rails, Solana’s relentless ecosystem growth and surging trading volume are setting the stage for what many now call the “New Wall Street. ” The numbers don’t lie: as of October 3,2025, Solana (SOL) is trading at $233.08, reflecting a robust market presence and institutional confidence.
Solana (SOL) Live Price & Intraday Chart
Powered by TradingView
Solana Trading Volume in 2025: Institutional Surge and Retail Momentum
Trading volumes on Solana have exploded in recent months, up a staggering 57% according to The Economic Times. This surge is more than just retail speculation – it’s driven by major financial players integrating with Solana’s lightning-fast settlement layer. The announcement of CME Group’s plans to launch Solana futures on March 17,2025, pending regulatory approval, signals a watershed moment for institutional adoption (source). If approved, this could pave the way for regulated Solana-based ETFs – a move already anticipated by filings from firms like VanEck and 21Shares (source).
“Solana’s throughput and composability are turning it into the backbone for tokenized stocks, bonds, and real-world assets (RWA). The capital markets are watching closely. “
Visualizing Solana’s Ecosystem Growth: From DeFi to Tokenized Wall Street
The breadth of activity on Solana is staggering. Beyond meme coins and GameFi, the chain is now home to pioneering projects in tokenized RWA stocks and bonds. Financial firms are piloting everything from tokenized U. S. Treasuries to synthetic equities on-chain. This diversification has translated into sticky liquidity and heightened developer activity – two key signals that set apart sustainable ecosystems from speculative bubbles.
Leah Donovan is a digital assets strategist with a background in fintech startups and algorithmic trading. With 6 years in the crypto space, she specializes in Solana ecosystem growth and GameFi. Leah’s analysis combines technical indicators with behavioral finance, delivering actionable trading strategies for dynamic markets. Her motto: ‘Patterns reveal profit.’
technical-analysismarket-research
Leah Donovan’s Insights
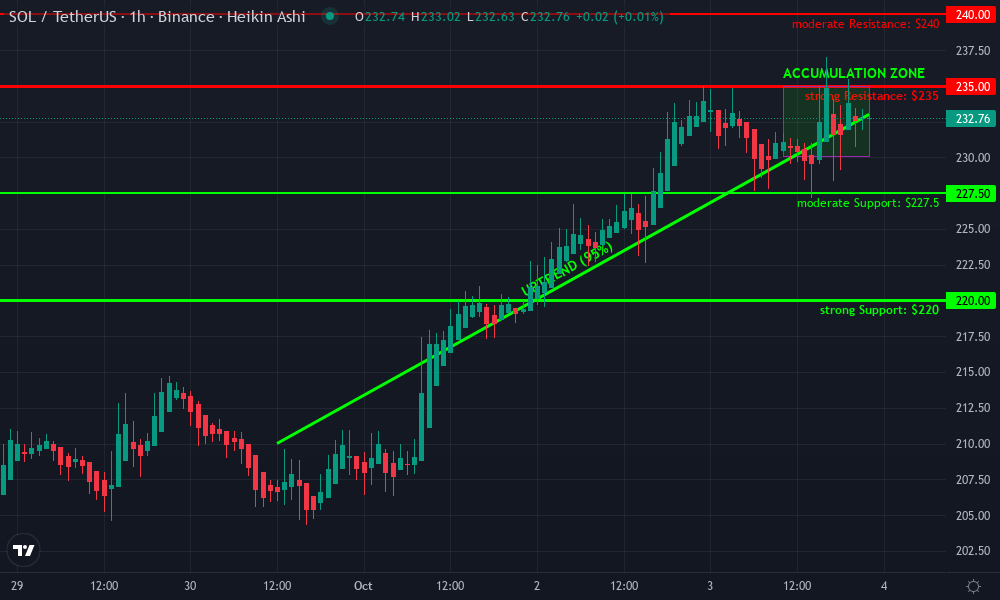
This chart screams momentum. Solana’s relentless upward grind since Oct 1st reflects not just technical strength but also the macro narrative—futures anticipation, ETF speculation, and surging volumes. The clean break above $225 flipped the script, and the current $232–$235 range feels like a bull flag before the next move. As a high-risk, aggressive trader, I’d be looking for breakout entries above $237 or mean reversion scalps near $227. The market is rewarding boldness, and I want to be ahead of the next impulse leg.
Technical Analysis Summary
Draw a strong uptrend line from near $208 (Sept 30th) to $237 (Oct 3rd), capturing the aggressive breakout. Mark horizontal support at $227.65 and resistance at $237.32. Highlight a consolidation rectangle between $230–$235 on Oct 3rd. Place a breakout arrow above $237, and a potential pullback arrow down to $227. Use long position boxes above $235 and short position markers below $227. Mark special event vertical lines at the start of October (trend reversal) and Oct 3rd (latest high). Annotate with text for aggressive bullish bias.
Risk Assessment:high
Analysis: Momentum traders are being rewarded, but risk of sharp pullback increases with each leg higher.Tight stops and aggressive profit taking are a must.
Leah Donovan’s Recommendation: I’m long-biased above $235, but nimble—ready to flip short if $227 fails.Risk is high,but so is opportunity in this phase of the Solana cycle.Size positions accordingly and trade the breakout,not the range.
Key Support & Resistance Levels
📈 Support Levels:
$227 .65 -24 h low and recent consolidation base.strong
$220 -Prior breakout and retest zone.moderate
📉 Resistance Levels:
$237 .32 -24 h high and immediate breakout pivot.strong
$235 -Aggressive breakout entry above local consolidation.high risk
$227 .65 -Bounce play at strong support if tested.medium risk
🚪 Exit Zones:
$237 .32 -First profit target at resistance.💰 profit target
$227 -Stop loss below major support.🛡️ stop loss
Technical Indicators Analysis
📊 Volume Analysis:
Pattern: Volume likely spiked on breakout and during consolidationwatch for uptick on next move.
Volume confirmation is critical—look for surges above $235 for breakout validity.
📈 MACD Analysis:
Signal: Likely bullish but extendedlook for MACD crossovers on lower timeframes for early signals.
MACD supports aggressive trend but monitor for bearish divergence.
Applied TradingView Drawing Utilities
This chart analysis utilizes the following professional drawing tools:
Trend LineHorizontal LineRectangleArrow MarkerLong PositionShort PositionVertical LineText
Disclaimer:This technical analysis by Leah Donovan is for educational purposes only and should not be considered as financial advice.Trading involves risk,and you should always do your own research before making investment decisions.Past performance does not guarantee future results.The analysis reflects the author’s personal methodology and risk tolerance(high).
According to Finder’s panel, industry specialists forecast an average price target of $331 by year-end, with bullish outliers eyeing $1,000 by 2030 (Benzinga). Meanwhile, InvestingHaven’s technical patterns support a range between $255-$480 (source). But what matters most isn’t just price – it’s utility. Every major jump in valuation has been matched by new use cases emerging on-chain.
Solana (SOL) Price Prediction: 2026–2031
Comprehensive expert projections based on current 2025 market data, adoption trends, and regulatory context.
Year
Minimum Price (Bearish)
Average Price (Consensus)
Maximum Price (Bullish)
% Change YoY (Avg)
Market Scenario Insights
2026
$210
$340
$520
+2.7%
Price consolidates after 2025 surge; ETF approvals and institutional inflows sustain growth. Bearish scenario reflects regulatory delays.
2027
$250
$410
$690
+20.6%
Increased adoption in DeFi/TradFi, successful ETF launches. Bearish case: macro headwinds or tech competition slow growth.
2028
$280
$470
$860
+14.6%
Mainstream TradFi integration, more Layer-2s and rollups. Bearish: scaling bottlenecks or regulatory setbacks.
2029
$320
$550
$1,050
+17.0%
Solana cements position as top-3 chain; major institutional products live. Bearish: global recession or security incidents.
2030
$370
$640
$1,250
+16.4%
Next-gen dApps, global payments, and cross-chain adoption. Bearish: loss of developer mindshare or harsh global regulation.
2031
$410
$720
$1,460
+12.5%
Widespread enterprise and retail use. Bearish: tech disruption from competitors or market cycle downturn.
Price Prediction Summary
Solana is positioned for steady growth over the next six years, with a consensus average price rising from $340 in 2026 to $720 by 2031. Bullish scenarios see SOL potentially reaching $1,460 if institutional adoption, ETF approvals, and network upgrades proceed smoothly. However, downside risks remain from regulatory, technological, or macroeconomic headwinds. Year-over-year average growth is projected between 12% and 21%, reflecting both optimism and market volatility.
Key Factors Affecting Solana Price
Regulatory approval and launch of Solana ETFs and futures products
Continued institutional adoption and inflows
Network scalability, upgrades, and ecosystem development (DeFi, NFTs, TradFi integration)
Competition from other Layer-1/Layer-2 chains (Ethereum, emerging platforms)
Potential for new use cases (payments, remittances, enterprise apps)
Security and technical reliability of the Solana network
Disclaimer: Cryptocurrency price predictions are speculative and based on current market analysis.
Actual prices may vary significantly due to market volatility, regulatory changes, and other factors.
Always do your own research before making investment decisions.
Expert Predictions: How High Can SOL Go?
The consensus among analysts is clear: Solana is positioned as a core pillar in the next wave of financial innovation. With current prices steady at $233.08, experts see significant upside if ETF approvals materialize or if tokenized asset adoption accelerates. CryptoRank recently reported that institutions scooped up over 6.8 million SOL on-chain this quarter alone – not just betting on price appreciation but on long-term network value.
Key Drivers Fueling Solana’s Wall Street Integration
CME Group’s Planned Solana Futures Launch: The CME Group—the world’s largest derivatives exchange—announced plans to introduce Solana futures on March 17, 2025 (pending regulatory approval). This move provides Wall Street with regulated tools for price risk management and signals growing institutional acceptance.
ETF Filings by Major Financial Firms: Leading asset managers like 21Shares and VanEck have filed with the SEC to launch Solana-linked ETFs. Approval of these ETFs would make Solana exposure more accessible to institutional and retail investors, mirroring the impact seen with Bitcoin ETFs.
Surging Institutional Trading Volumes: Solana’s trading volume has seen a 57% increase in recent days (The Economic Times), reflecting heightened institutional interest and liquidity—a critical factor for Wall Street adoption.
Strong and Stable Price Performance: As of October 3, 2025, Solana (SOL) is trading at $233.08, up 0.54% in the last 24 hours. This price stability and upward momentum enhance its credibility as a reliable asset for institutional portfolios.
Bullish Analyst Predictions for 2025: Panels of crypto industry experts forecast Solana’s average price at $331 by end of 2025 (Finder), with some estimates reaching $480 (InvestingHaven). These bullish outlooks are driving increased Wall Street attention and positioning Solana as a serious contender alongside Bitcoin and Ethereum.
Technological Advancements and Ecosystem Growth: Solana’s high throughput, low transaction costs, and expanding DeFi and NFT ecosystems continue to attract institutional developers and investors, reinforcing its integration into traditional finance.
Solana’s edge lies in its ability to blend the speed and cost-efficiency of Web3 with the regulatory ambitions of traditional finance. As CME Group’s futures launch looms and ETF filings await SEC decisions, liquidity is flowing into Solana at a pace that outstrips most competitors. The $233.08 price point isn’t just a number, it’s a signal of institutional validation and growing on-chain utility.
Zooming out, the Solana ecosystem is rapidly onboarding not only DeFi projects but also traditional financial products, RWAs, tokenized stocks, and even synthetic bonds. This convergence is what sets Solana apart from legacy chains. Developers are leveraging composability to create permissionless derivatives, real-time settlement for tokenized U. S. Treasuries, and cross-chain bridges that link TradFi with DeFi rails.
Solana Tokenized Assets: The RWA Revolution Gains Steam
Tokenization of real-world assets (RWA) is no longer a buzzword, it’s happening live on Solana. From pilot programs with U. S. Treasury bills to synthetic equity trading desks, institutions are experimenting with on-chain settlement for speed, transparency, and reduced counterparty risk. The result? Stickier liquidity and increased developer activity, two metrics that correlate tightly with long-term price appreciation.
“We’re seeing the first true migration of Wall Street infrastructure onto public blockchains, and Solana is leading the charge. ”
This isn’t just about speculation anymore; it’s about utility-driven growth. The expansion into tokenized stocks and bonds is driving new inflows from both retail traders seeking yield opportunities and institutional players hedging risk or arbitraging inefficiencies.
Top Drivers of Solana’s Wall Street Integration
CME Group’s Launch of Solana Futures: The CME Group plans to introduce Solana futures on March 17, 2025, pending regulatory approval. This move positions Solana alongside Bitcoin and Ethereum in the regulated derivatives market, providing institutional investors with new tools for risk management and exposure.
Pending Solana ETFs from 21Shares and VanEck: Leading financial firms 21Shares and VanEck have filed for Solana-based ETFs, with SEC decisions expected soon. Approval would enable Wall Street to access Solana via regulated exchange-traded products, accelerating mainstream adoption.
Surging Institutional Trading Volumes: Solana’s trading volume has soared, with a recent 57% spike and its price currently at $233.08 (as of October 3, 2025). This robust activity signals strong institutional interest and liquidity, key factors for Wall Street integration.
Bullish Analyst Forecasts and Price Predictions: Industry experts from Finder and InvestingHaven forecast Solana prices between $220 and $480 by late 2025. These optimistic projections are fueling further Wall Street interest and capital inflows.
Technological Advancements and Ecosystem Growth: Solana’s high-speed, low-cost blockchain continues to attract developers and DeFi projects. Its expanding ecosystem strengthens its appeal as a foundation for financial products and services favored by institutional investors.
SOL Price Milestone: Holding Strong at $233.08 Amid Institutional Accumulation
While some analysts project SOL could reach as high as $331 by year-end (Finder) or even $1,000 by 2030 (Benzinga), the current price action tells its own story. After rebounding from lows near $190 in recent months, SOL has stabilized above $230, attracting both speculative capital and long-term strategic buys by institutions.
The technical landscape remains bullish, with support at $220 and resistance forming near $250, but what stands out most is volume: up 57% year-over-year as per The Economic Times. This surge signals not only heightened trading activity but also deeper liquidity pools, a prerequisite for large-scale institutional strategies.
2025 Outlook: Solana’s Wall Street Moment?
If current trends persist, regulatory greenlights for futures/ETFs, continued RWA innovation, sticky developer growth, Solana could cement its role as the “New Wall Street” backbone by 2025-2026. The next six months will be pivotal as ETF decisions unfold and more RWAs migrate on-chain.
For traders, builders, and institutions alike, Solana isn’t just another blockchain, it’s rapidly becoming the preferred platform for tokenized finance at scale. With $233.08 now established as a key support level amid surging volumes and mainstream adoption narratives, all eyes remain fixed on how high this ecosystem can climb, and how fast traditional markets will follow its lead into decentralized rails.