Solana’s market cap is rewriting the record books, smashing past $130 billion and counting. This all-time high comes at a time when many expected the opposite, given the looming specter of major token unlocks. Yet here we are: as of September 21,2025, Solana (SOL) trades at $238.54, with its market capitalization holding firm above the $130 billion mark. What’s fueling this resilience? Let’s break down the data and chart action to reveal why Solana continues to defy bearish expectations.
Solana (SOL) Live Price & Market Cap
Powered by TradingView
Solana Market Cap Chart: New Highs Amid Token Unlocks
First, let’s address the elephant in the room: token unlocks. In 2025 alone, over 15 million SOL – worth more than $7 billion at current prices – entered circulation from institutional vesting schedules (notably Galaxy, Pantera, and Figure). Historically, such massive inflows would trigger fears of dilution and price drops. But Solana’s market cap chart tells a different story.
Instead of a sell-off, the influx has been absorbed by robust demand. The network is seeing record daily active addresses and surging transaction volumes. According to CryptoSlate, new wallet creation is at all-time highs – a clear signal that retail and institutional appetite for SOL remains strong despite increased supply.
The answer lies in ecosystem growth and narrative momentum. Memecoin mania is alive and well on Solana; tokens like Dogwifhat and Bonk have brought fresh capital onto the chain, igniting speculative fervor that translates directly into higher demand for SOL as gas. This isn’t just hype – it’s visible on-chain activity.
Network Activity: Daily transactions are up double digits month-over-month.
User Growth: New addresses are consistently breaking records.
DApp Adoption: DeFi TVL on Solana has surged alongside NFT trading volumes.
This flywheel effect means every new user or project amplifies demand for SOL – counterbalancing any dilution from unlocks. It’s a virtuous cycle that traders ignore at their peril.
Solana Trading Insights: Price Action Speaks Louder Than Fear
The charts don’t lie. After reaching an all-time high of $295 on January 19,2025, SOL experienced a sharp correction down to $132 by late February. Many called it the end of the bull run. Yet since then, buyers have stepped in with conviction, driving prices back up to today’s $238.54.
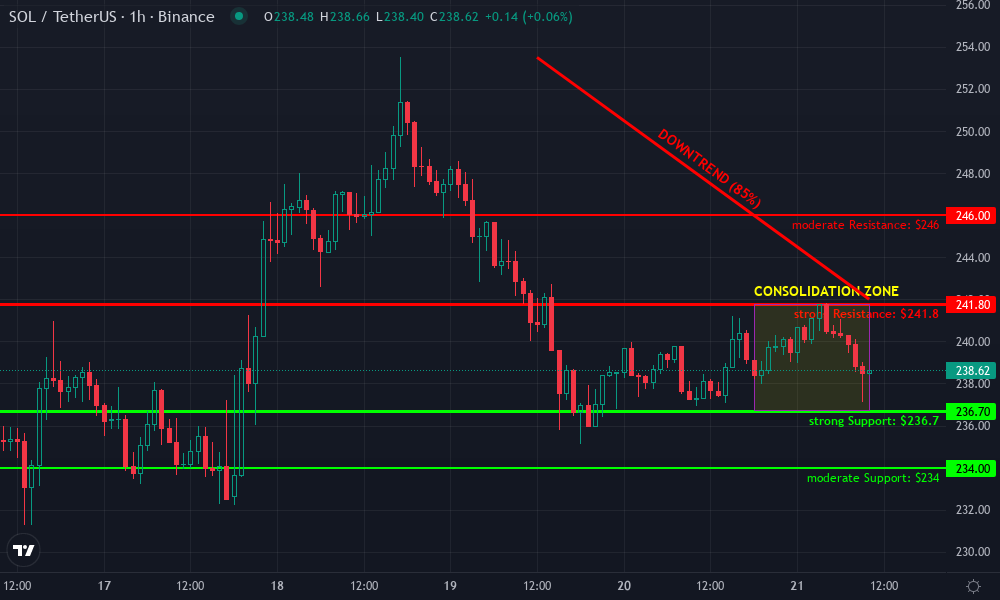
Solana Technical Analysis Chart
Analysis by Ava Carlisle | Symbol: BINANCE:SOLUSDT | Interval: 4h | Drawings: 6
Ava Carlisle is a certified technical analyst (CMT) and full-time trader who thrives on the volatility of crypto markets. With 5 years of hands-on experience, she specializes in Solana memecoins and short-term swing trades. Ava is passionate about empowering new traders with clear, actionable chart setups and risk controls. Her motto: ‘Trade smart, trade swift.’
technical-analysisrisk-management
Ava Carlisle’s Insights
This Solana chart is screaming opportunity for aggressive swing plays. After the failed breakout above $253.50, we’ve seen a textbook step-down followed by range-bound chop. The liquidity sweep below $236.70 shows whales are still hunting stops. There’s a clear battle between bulls and bears at the current $238.64 price, with volume likely to spike on either a range break or a fakeout. I’m watching for a quick long scalp at the bottom of the range, but I’m ready to pivot short if $236.70 fails decisively. In this environment, conviction and tight risk control are everything.
Technical Analysis Summary
Draw a primary downtrend line from the local high near $253.50 on September 19, 2025, to the lower highs near $242.00 on September 21, 2025. Mark a secondary, shorter-term consolidation channel between $236.70 and $242.80 for the last 24 hours. Highlight the major support at $236.70 and resistance at $241.80 with horizontal lines. Use rectangles to emphasize the consolidation range. Place a callout for the sharp reversal wick just below $236.70, indicating a liquidity grab. If using indicators, overlay MACD and volume panels to confirm momentum shifts. Draw an arrow pointing to the recent bearish rejection near $241.80. Annotate possible aggressive long entry near $236.70 with tight stop below $235.80, targeting $241.80 resistance.