
Solana’s relentless climb in blockchain performance has redefined what’s possible for decentralized applications in 2025. With Binance-Peg SOL trading at $191.22 as of October 12,2025, Solana’s market momentum isn’t just about price action. It’s about the core metrics that matter: transactions per second (TPS) and transaction fees. In a landscape where Ethereum and Base are still struggling with congestion and cost, Solana is setting a new standard for speed and affordability. Let’s break down exactly how Solana is outpacing its rivals, using hard data and a pragmatic lens.
Solana vs Ethereum 2025: The TPS Race
When it comes to raw throughput, Solana is in a league of its own. The numbers are staggering: Solana regularly processes between 3,000 to 5,000 TPS, with a theoretical ceiling of 65,000 TPS. Compare this to Ethereum’s mainnet, which continues to hover at 15 to 30 TPS. Even with the rise of Layer-2 solutions like Base, which can deliver up to 2,000 TPS, Solana’s advantage remains clear and decisive.
Why does this matter? High TPS translates to seamless user experiences, no matter how congested the network gets. NFT mints, DeFi swaps, and on-chain gaming all run smoother when the network isn’t a bottleneck. The result: more users, more builders, and more capital flowing into the Solana ecosystem.
Solana Technical Analysis Chart
Analysis by Ava Carlisle | Symbol: BINANCE:SOLUSDT | Interval: 4h | Drawings: 6
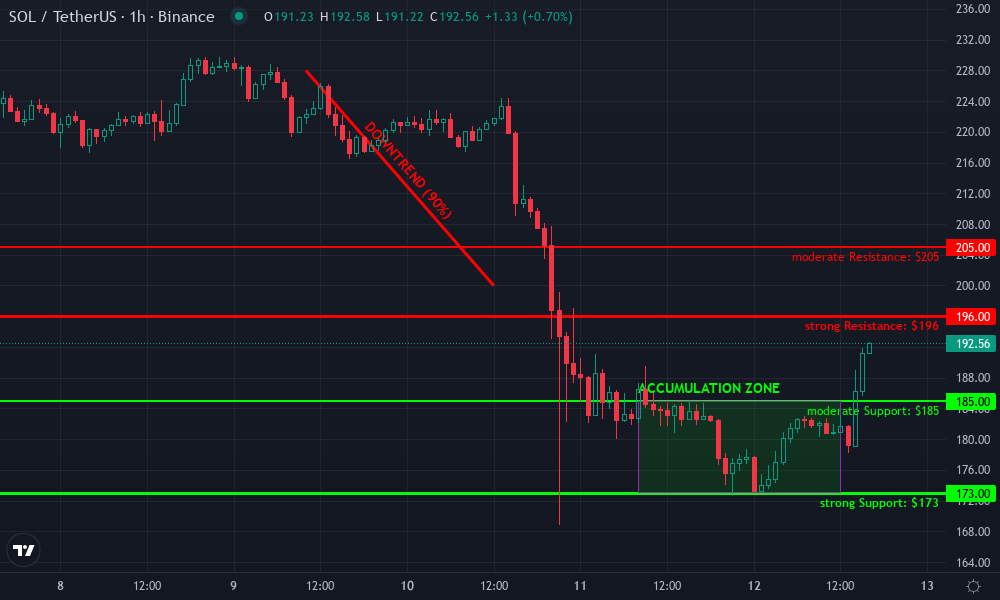
Technical Analysis Summary
Draw a dominant downtrend line from the swing high near $228 (Oct 9, 2025) to the breakdown around $200 (Oct 10, 2025), and extend it as resistance. Mark the horizontal support at $173 (recent low on Oct 11, 2025) and resistance at $196 (pre-breakdown support turned resistance). Use a rectangle to highlight the consolidation/accumulation zone between $173 and $185 (Oct 11 - 12, 2025). Add an arrow marker and text at the breakout candle (Oct 12, 2025, 12:00) signaling potential reversal. Place a long position tool above $192 (current price) targeting $196, with a stop near $185 for an aggressive swing setup. Utilize the fib retracement tool from $228 to $173 to map retracement targets. Use callouts for key volume surges if visible.
Risk Assessment: high
Analysis: Volatility is extreme, V-reversal is aggressive and could result in swift rejection if momentum fails. Tight stops are a must.
Ava Carlisle's Recommendation: Take aggressive longs with tight stops and quick execution. Do not overstay—take profits at resistance and cut losses swiftly. Solana's fundamentals are on your side, but the technicals demand discipline.
Key Support & Resistance Levels
📈 Support Levels:
- $173 - Recent major swing low, strong support from high-volume bounce. strong
- $185 - Short-term support from consolidation before the breakout. moderate
📉 Resistance Levels:
- $196 - Former support, likely to serve as near-term resistance. strong
- $205 - Next notable resistance from prior breakdown area. moderate
Trading Zones (high risk tolerance)
🎯 Entry Zones:
- $188 - Aggressive entry on pullback after breakout, targeting swift momentum continuation. high risk
🚪 Exit Zones:
- $196 - First profit target at key resistance. 💰 profit target
- $185 - Stop-loss below post-breakout consolidation. 🛡️ stop loss
Technical Indicators Analysis
📊 Volume Analysis:
Pattern: Anticipate high volume on breakout candles; use callout to highlight volume surge confirming reversal.
Volume surge likely confirmed the $173 bottom and breakout above $188.
📈 MACD Analysis:
Signal: Likely bullish crossover on breakout.
MACD would likely show a bullish cross concurrent with this aggressive reversal. Use arrow_mark_up to highlight.
Applied TradingView Drawing Utilities
This chart analysis utilizes the following professional drawing tools:
Disclaimer: This technical analysis by Ava Carlisle is for educational purposes only and should not be considered as financial advice. Trading involves risk, and you should always do your own research before making investment decisions. Past performance does not guarantee future results. The analysis reflects the author's personal methodology and risk tolerance (high).
Transaction Fees: Solana’s Cost Advantage
Speed is only half the story. In crypto, every cent counts - and Solana’s ultra-low fees are a game changer. The average transaction fee on Solana sits at a microscopic $0.00025 per transaction. That’s not a typo. Meanwhile, Ethereum’s mainnet fees still swing between $2 and $10 in low congestion, and can spike much higher during NFT launches or DeFi frenzies. Even Base, Ethereum’s most efficient Layer-2, averages $0.0004–$0.001 per transaction, which, while competitive, still can’t match Solana’s razor-thin costs.
This fee structure isn’t just a technical flex - it’s a fundamental shift in user accessibility. For the first time, microtransactions, play-to-earn gaming, and high-frequency trading are viable at scale. Developers can build dApps that would be cost-prohibitive on other chains.
Cryptocurrency 6-Month Price Comparison: Solana vs Ethereum, Base & Others
A real-time snapshot of major crypto assets' price performance over the past six months (as of 2025-10-12)
| Asset | Current Price | 6 Months Ago | Price Change |
|---|---|---|---|
| Solana (SOL) | $192.10 | $178.99 | +7.3% |
| Ethereum (ETH) | $4,041.59 | $3,700.00 | +9.2% |
| Base Protocol (BASE) | $0.2866 | $0.2500 | +14.6% |
| Bitcoin (BTC) | $113,342.00 | $118,342.00 | -4.2% |
| BNB Chain (BNB) | $1,303.93 | $1,200.00 | +8.7% |
| Avalanche (AVAX) | $22.40 | $23.75 | -5.7% |
| Polygon (MATIC) | $0.1964 | $0.3858 | -49.1% |
| Cardano (ADA) | $0.6811 | $0.6397 | +6.5% |
Analysis Summary
Over the past six months, Base Protocol (BASE) led with the highest percentage gain (+14.6%), followed by Ethereum (+9.2%), BNB Chain (+8.7%), Solana (+7.3%), and Cardano (+6.5%). Bitcoin, Avalanche, and especially Polygon experienced declines, with Polygon dropping nearly half its value (-49.1%). Solana showed steady growth, reinforcing its strong position in both price performance and network efficiency.
Key Insights
- Base Protocol (BASE) outperformed all listed assets in 6-month price growth (+14.6%).
- Ethereum and Solana both posted solid gains, with Ethereum slightly ahead (+9.2% vs +7.3%).
- Polygon (MATIC) suffered the largest loss, declining by 49.1%.
- Bitcoin and Avalanche experienced moderate declines, while BNB Chain and Cardano saw moderate gains.
- Solana's price growth aligns with its continued leadership in transaction speed and low fees, making it a standout for network efficiency.
This comparison uses real-time price data as of October 12, 2025, with historical prices from exactly six months prior. All figures are sourced directly from CoinGecko and reflect actual market performance, ensuring accuracy and reliability.
Data Sources:
- Main Asset: https://www.coingecko.com/en/all-cryptocurrencies
- Ethereum: https://www.coingecko.com/en/all-cryptocurrencies
- Base Protocol: https://www.coingecko.com/en/all-cryptocurrencies
- Bitcoin: https://www.coingecko.com/en/all-cryptocurrencies
- BNB Chain: https://www.coingecko.com/en/all-cryptocurrencies
- Avalanche: https://www.coingecko.com/en/all-cryptocurrencies
- Polygon: https://www.coingecko.com/en/all-cryptocurrencies
- Cardano: https://www.coingecko.com/en/all-cryptocurrencies
Disclaimer: Cryptocurrency prices are highly volatile and subject to market fluctuations. The data presented is for informational purposes only and should not be considered as investment advice. Always do your own research before making investment decisions.
Real-Time Price Action: Solana Maintains Strength Above $190
It’s not just about the tech. The market is responding to these performance metrics in real time. As of today, Binance-Peg SOL sits at $191.22, up $7.23 ( and 0.0393%) over the past 24 hours, with a daily range between $173.14 and $191.67. This resilience highlights growing confidence in Solana’s ability to deliver on its promises, even as broader crypto markets remain volatile.
"Solana’s throughput and fee structure are unlocking new business models in Web3 that simply aren’t possible on legacy blockchains. "
Blockchain Performance Comparison: Visualizing the Gap
The data speaks for itself, but visuals drive the point home. Let’s look at a side-by-side performance snapshot for 2025:
Blockchain TPS and Fee Comparison (2025) 🚀
| Blockchain | Transactions Per Second (TPS) ⚡ | Average Transaction Fee 💸 | Latest Price (if available) |
|---|---|---|---|
| Solana (SOL) | 3,000–5,000 (Max: 65,000) | $0.00025 | $191.22 |
| Ethereum (ETH) | 15–30 | $2–$10 (can spike higher) | N/A |
| Base (Ethereum L2) | Up to 2,000 | $0.0004–$0.001 | N/A |
Solana isn’t just winning on paper - it’s dominating in the metrics that matter for users and developers alike. For those seeking exposure to a blockchain ecosystem that prioritizes efficiency, scalability, and real-world utility, the numbers make a compelling case.
Solana (SOL) Price Prediction 2026-2031: Outperforming Ethereum and Base
Comprehensive outlook based on Solana's technical edge, adoption, and market competition (2025 baseline: $191.22)
| Year | Minimum Price (Bearish) | Average Price (Base Case) | Maximum Price (Bullish) | Yearly % Change (Avg) | Key Market Scenario |
|---|---|---|---|---|---|
| 2026 | $155.00 | $210.00 | $290.00 | +9.8% | Post-Bull Run Correction & Consolidation |
| 2027 | $170.00 | $245.00 | $370.00 | +16.7% | Resumed Adoption, Layer-1 Leadership |
| 2028 | $195.00 | $295.00 | $450.00 | +20.4% | DeFi/NFT Expansion, Institutional Entry |
| 2029 | $225.00 | $355.00 | $570.00 | +20.3% | Mainstream Integration, Regulatory Clarity |
| 2030 | $265.00 | $420.00 | $720.00 | +18.3% | Global Web3 Growth, New Use Cases |
| 2031 | $305.00 | $480.00 | $900.00 | +14.3% | Market Maturity, Interoperability Peak |
Price Prediction Summary
Solana is positioned for continued growth through 2031, leveraging its technical superiority in TPS and low fees versus Ethereum and Base. Despite short-term volatility and market cycles, average prices are projected to rise steadily, reflecting increasing adoption, improved scalability, and broader ecosystem development. Bearish scenarios reflect macro risks or competitive threats, while bullish cases assume rapid market expansion and Solana's successful capture of enterprise and DeFi/NFT markets.
Key Factors Affecting Solana Price
- Solana's consistent technical edge (high TPS, low fees) attracting developers and users.
- Market cycles: potential for corrections post-bull runs, followed by periods of strong recovery.
- Ecosystem growth: DeFi, NFTs, and new dApps driving transaction volume and demand for SOL.
- Regulatory developments: Favorable or neutral global crypto regulations could accelerate adoption; adverse policies could suppress growth.
- Competition: Ongoing rivalry with Ethereum, Base, and emerging L1/L2s may influence Solana's market share.
- Institutional adoption: Entry of traditional finance and global enterprises could drive price appreciation.
- Scalability improvements or network outages: Technical upgrades versus reliability concerns will impact sentiment.
Disclaimer: Cryptocurrency price predictions are speculative and based on current market analysis. Actual prices may vary significantly due to market volatility, regulatory changes, and other factors. Always do your own research before making investment decisions.
As the Solana ecosystem matures, the downstream effects of its technical edge are becoming impossible to ignore. Developers are shipping dApps that would be cost-prohibitive elsewhere, while users enjoy near-instant finality and negligible fees. In 2025, this isn’t just theoretical: it’s visible in network activity, TVL growth, and active user stats across key protocols.
Solana Ecosystem Analysis: Where Builders and Users Flock
High throughput and low fees have a compounding effect on ecosystem growth. Solana’s DeFi protocols are seeing record user engagement thanks to frictionless swaps and lightning-fast settlements. NFT marketplaces, previously bottlenecked by mainnet congestion on Ethereum, now handle mass mint events without a hitch. Even high-frequency trading bots and on-chain games, once pipe dreams, are thriving due to Solana’s technical foundation.
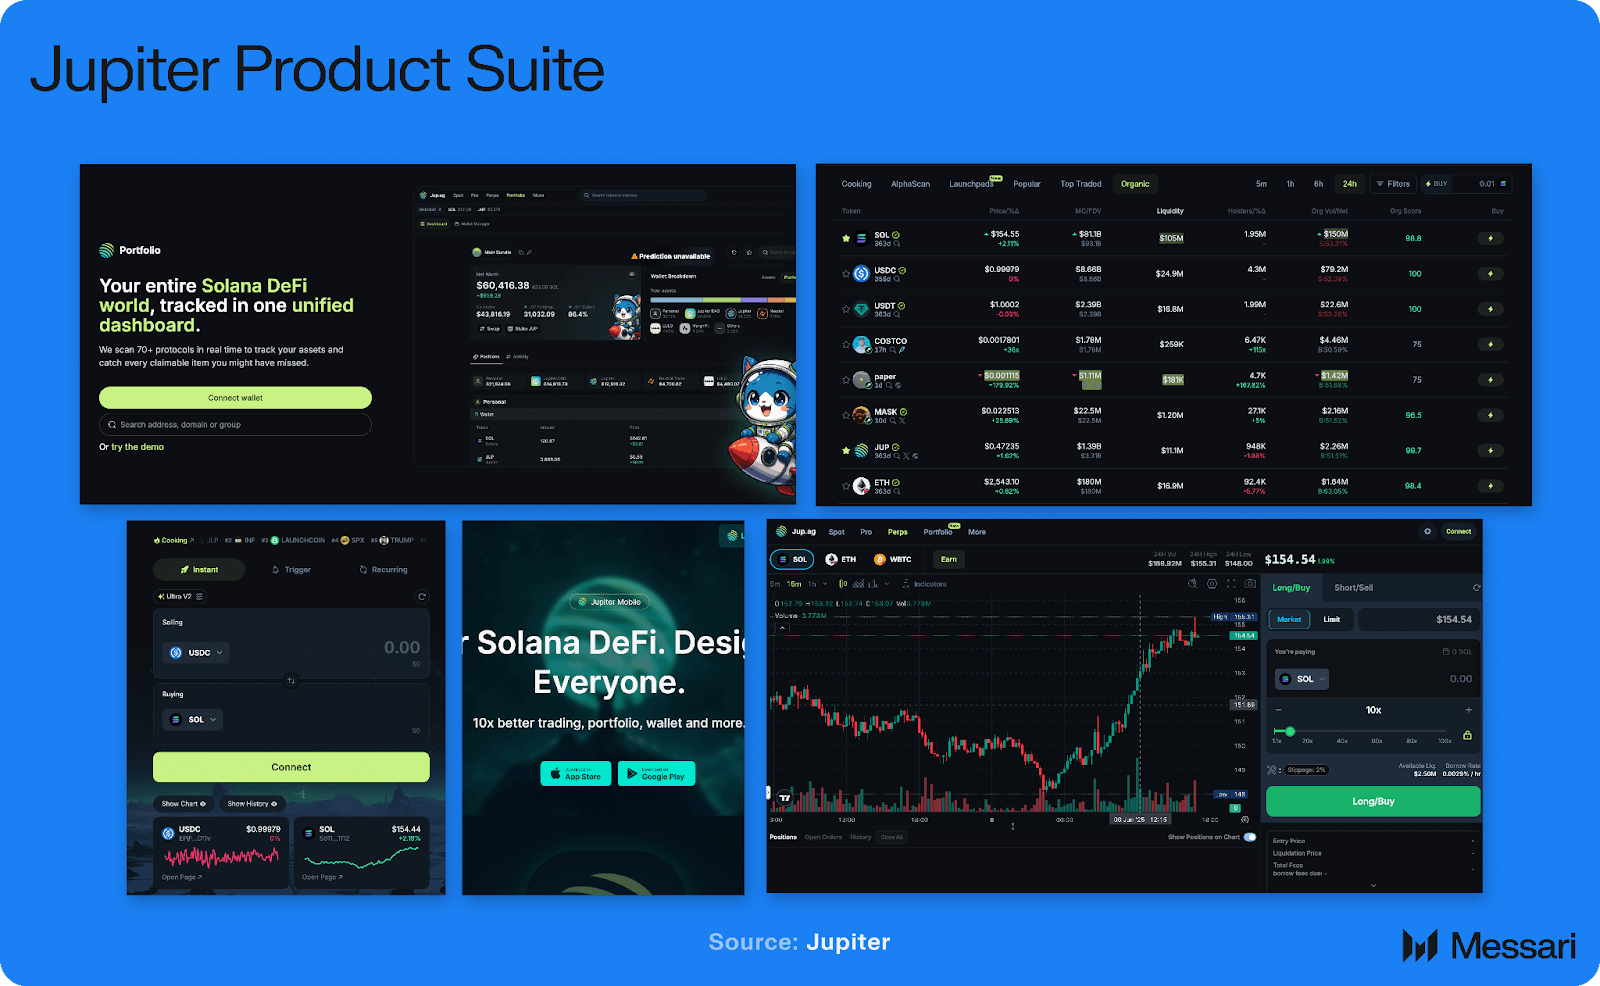
Top 5 Fastest-Growing Solana dApps in 2025
- Jupiter — As Solana’s leading decentralized exchange (DEX) aggregator, Jupiter has seen explosive growth in 2025, processing millions of trades daily with near-zero fees and lightning-fast swaps.
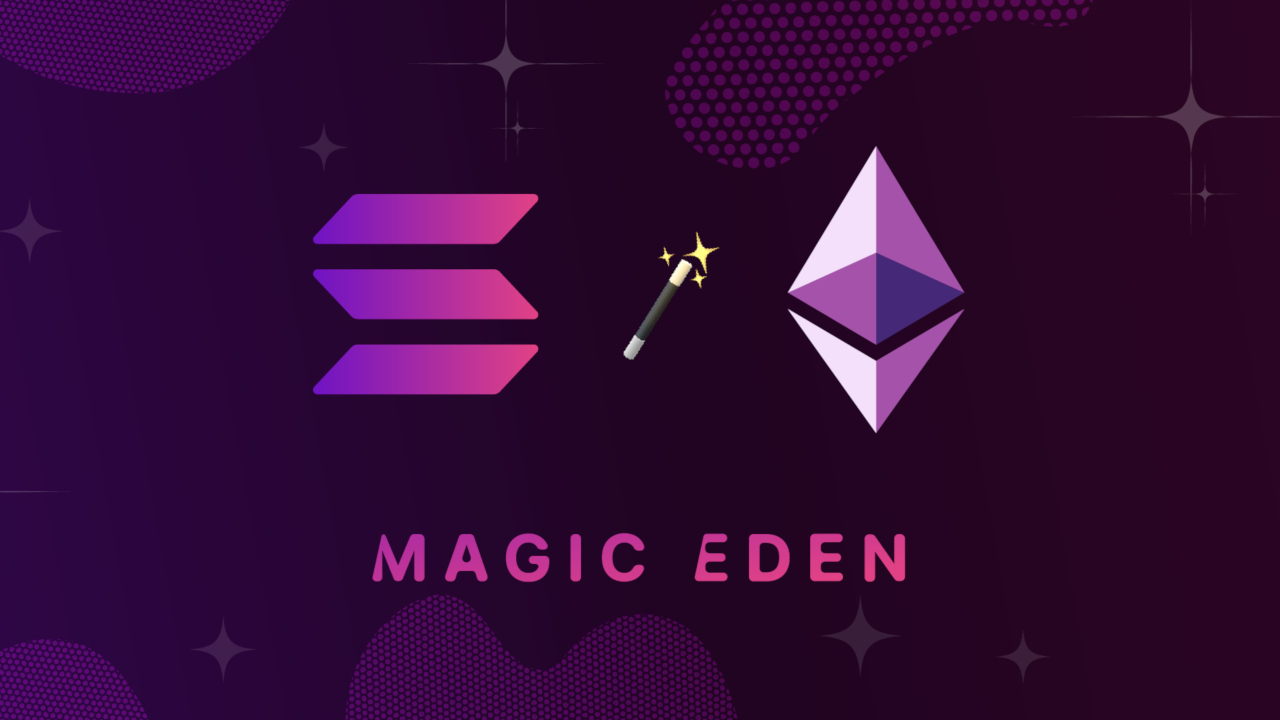
- Magic Eden — Magic Eden remains the dominant NFT marketplace on Solana, boasting record-breaking NFT sales volumes and a rapidly expanding user base throughout 2025.
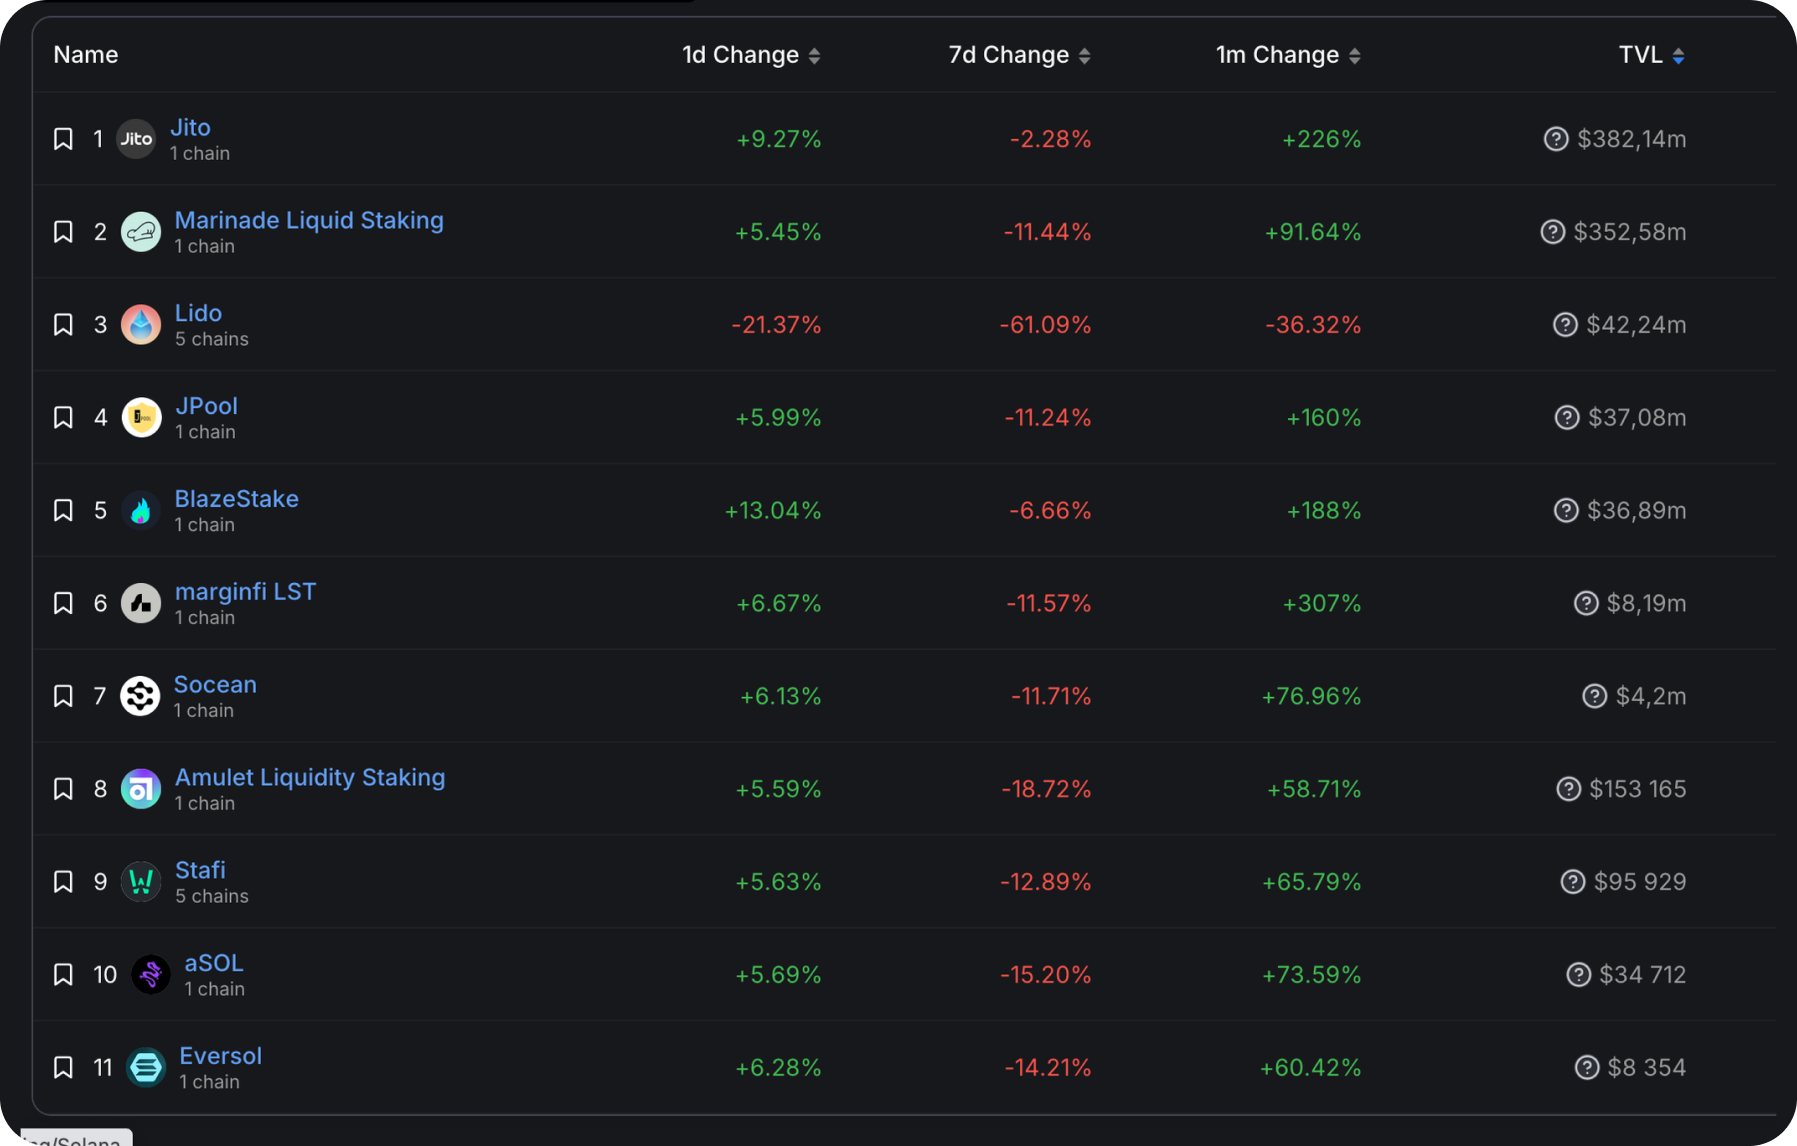
- Marinade Finance — Marinade Finance leads Solana’s liquid staking sector, offering users flexible staking solutions and contributing to the network’s decentralization and security.
- Drift Protocol — Drift Protocol is Solana’s top decentralized perpetuals exchange, experiencing surging trading volumes as users flock to its low-fee, high-speed derivatives platform.
- Tensor — Tensor has rapidly emerged as a premier NFT trading platform on Solana, attracting professional traders with advanced analytics and high liquidity.
This isn’t just hype. Data from Coinlib.io and Cointelegraph confirms that Solana’s daily active users and developer activity continue to outpace most competitors in 2025. The result is a virtuous cycle: lower costs attract more experimentation, which leads to higher-quality apps, more users, and further price support for SOL.
The Risk-Reward Equation: Why Efficiency Matters for Traders
If you’re an active trader or investor, these metrics aren’t just academic, they’re actionable signals. With Binance-Peg SOL at $191.22, the market is clearly pricing in Solana’s operational advantage over Ethereum and Base. But what does this mean for your portfolio?
Simply put: lower fees mean higher net returns for traders executing frequent transactions or leveraging on-chain strategies. Scalability also reduces slippage during volatile periods, a critical edge when every basis point counts. For swing traders like myself, these factors directly translate into improved risk-adjusted returns.
Of course, no blockchain is without risk. Outages, centralization debates, or regulatory headwinds could impact sentiment. But as of Q4 2025, the data-driven case for Solana remains robust, and the price action above $190 reflects that confidence.
What’s Next? Solana’s Roadmap and Competitive Outlook
Looking ahead, Solana’s core devs are doubling down on network upgrades aimed at further boosting throughput while maintaining decentralization. With Ethereum still grappling with Layer-2 fragmentation and fee unpredictability, the window for Solana to cement its lead remains wide open.
The bottom line? For builders, traders, and anyone watching the blockchain performance comparison closely, Solana’s combination of high TPS, ultra-low fees, and strong ecosystem momentum makes it the platform to watch as we close out 2025.


No comments yet. Be the first to share your thoughts!